Review the WAF Bot Dashboard
Scenario
Have you enabled the AWS WAF Bot detection rule in an earlier exercise, your Bot Control dashboard should contain some interesting data for analyzation. Review the dashboard to analyze the bot activity on your site.
Instructions
Access your WebACL console. From there, switch to the Bot Control tab and review the recorded data from the last 1 hour. Use the dashboard to get a quick insight into bot traffic on your site, then answer the following questions.
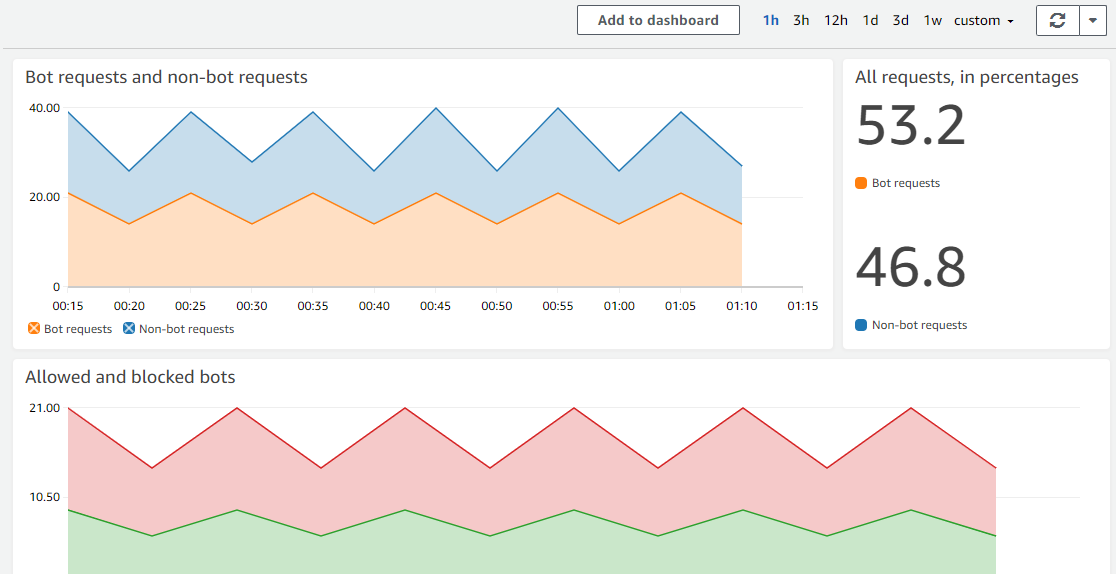
- How much of the traffic is bots (in percentage)?
- How many bots were allowed and blocked through in the last 5 minutes?
- What is the top category of bots?
- How many times did Zyborg bot attempt to reach your website in the last 5 minutes?
There are no validation or verification steps in this exercise.
Procedure
Navigate to the Bot Control dashboard
Navigate to the WebACL in the AWS WAF console
Switch to the Bot Control tab
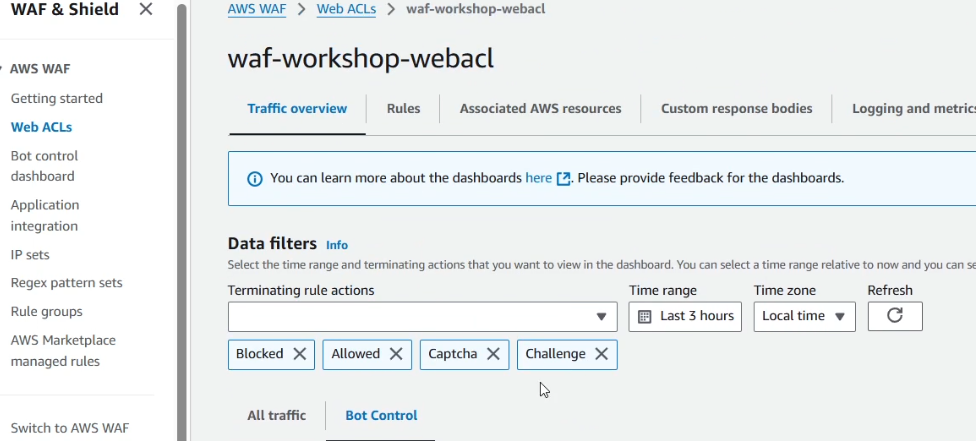
- You should see graphs similar to those in the screenshot
Collect the metrics
Check the data under All requests, in percentages
Click on 1h in the top right of the dashboard
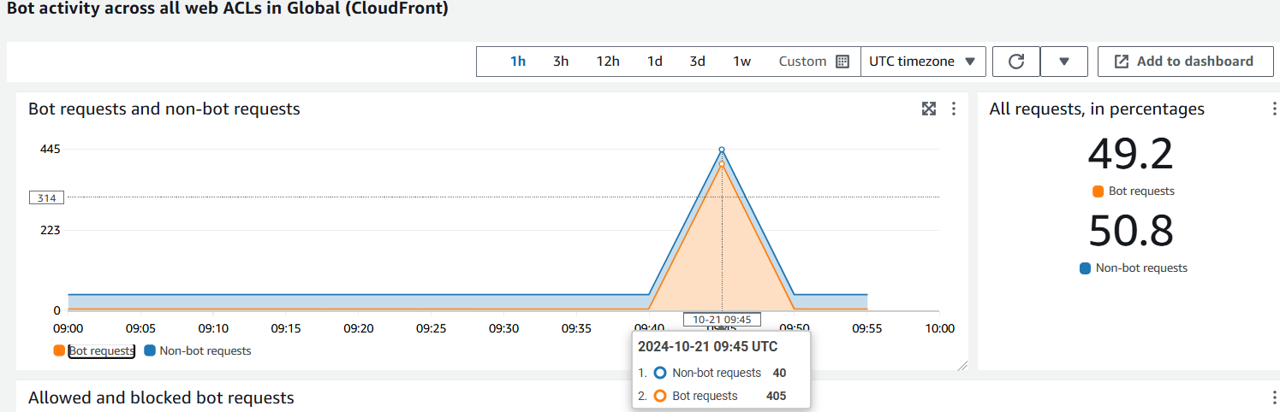
The chart will show the data of the last hour in 5-minute time intervals
Review the number of allowed requests in comparision with the block reports within the last 5 minutes.
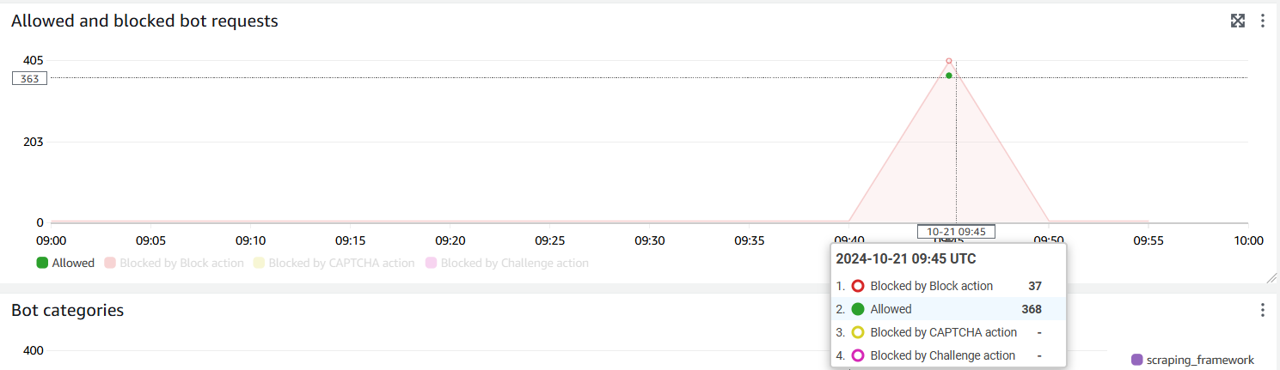
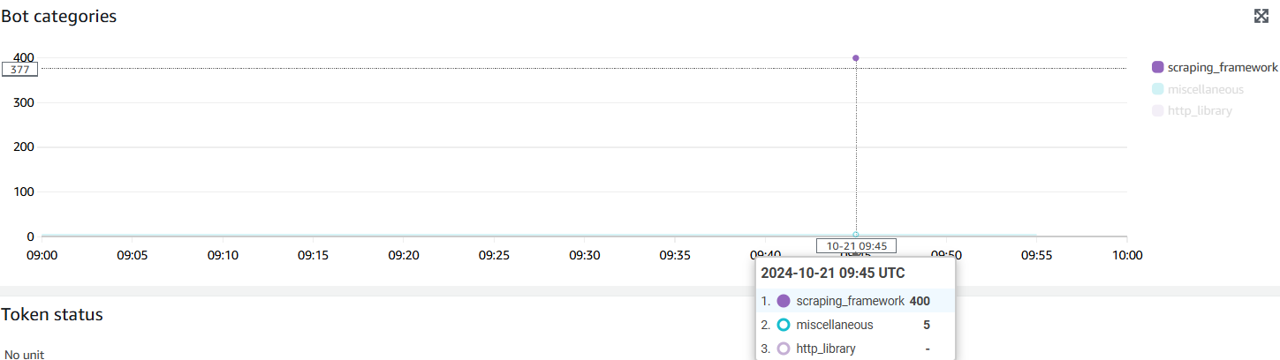
- The next graph down shows the top categories of bots
Collect Data on a Specific Bot
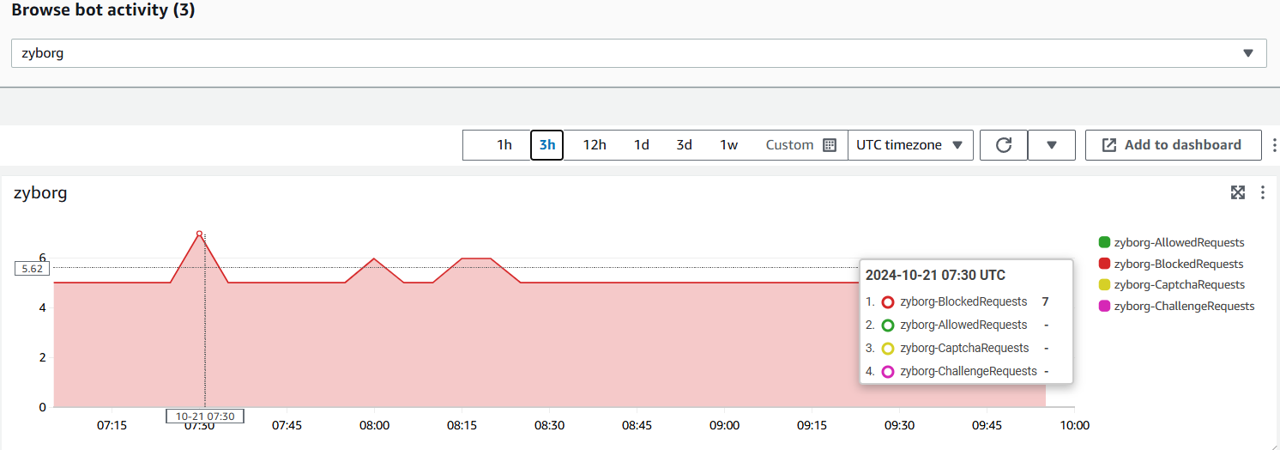
- In Browse bot activity dropdown, select Zyborg.
- The chart below will show data for the Zyborg bot (similar to this screenshot):
Congratulations! You have successfully learned how to quickly analyze bot traffic in the Bot Control dashboard.