Enriching security findings with investigative data
In today’s quickly evolving threat landscape, understanding risk and reaching the root cause of an issue in a timely manner is critical to businesses. Amazon Detective makes it easier to analyze, investigate, and quickly identify the root cause of potential security issues or suspicious activities. Amazon Detective supports the ability to automatically investigate AWS Identity and Access Management (IAM) entities for indicators of compromise (IoC). This capability helps security analysts determine whether IAM entities have potentially been compromised or involved in any known tactics, techniques, and procedures (TTP) from the MITRE ATT&CK framework. You can programmatically use the Detective Investigation API to help investigate potential security issues.
Security Hub is a cloud security posture management tool that automatically detects when your AWS accounts and resources deviate from security best practices, aggregates security alerts into a single place and format, and understands your overall security posture across all of your AWS accounts. Security Hub gives you the option to send findings to another security solution, such as AWS Security Lake or an AWS Partner Network (APN) solution. Many customers leverage AWS Security Hub to detect security misconfigurations and to review and prioritize security findings. They prefer the simplified, centralized view of findings in Security Hub over reviewing and prioritizing findings in each of the services and regions they originate from.
Amazon GuardDuty is an intelligent threat detection service that continuously monitors your AWS accounts, workloads, runtime activity, and data for malicious activity. If potential malicious activity, such as anomalous behavior or credential exfiltration is detected, GuardDuty generates detailed security findings. Once you enable GuardDuty and Security Hub in the same account within the same AWS Region, GuardDuty starts sending all the generated findings to Security Hub.
In this module, you will build a solution that integrates Detective with Security Hub giving you better visibility into threat indicators and investigative data directly from Security Hub. This allows you to perform more timely investigations of GuardDuty findings from a centralized view. The solution will perform the enrichment automatically for high and medium severity findings and gives you the flexibility to initiate additional investigations and enrichment on-demand. By enriching findings in Security Hub, you have the option of reviewing those enriched finding directly in the Security Hub console, or you can enable an integration to review the enriched findings in your solution of choice.
The solution architecture
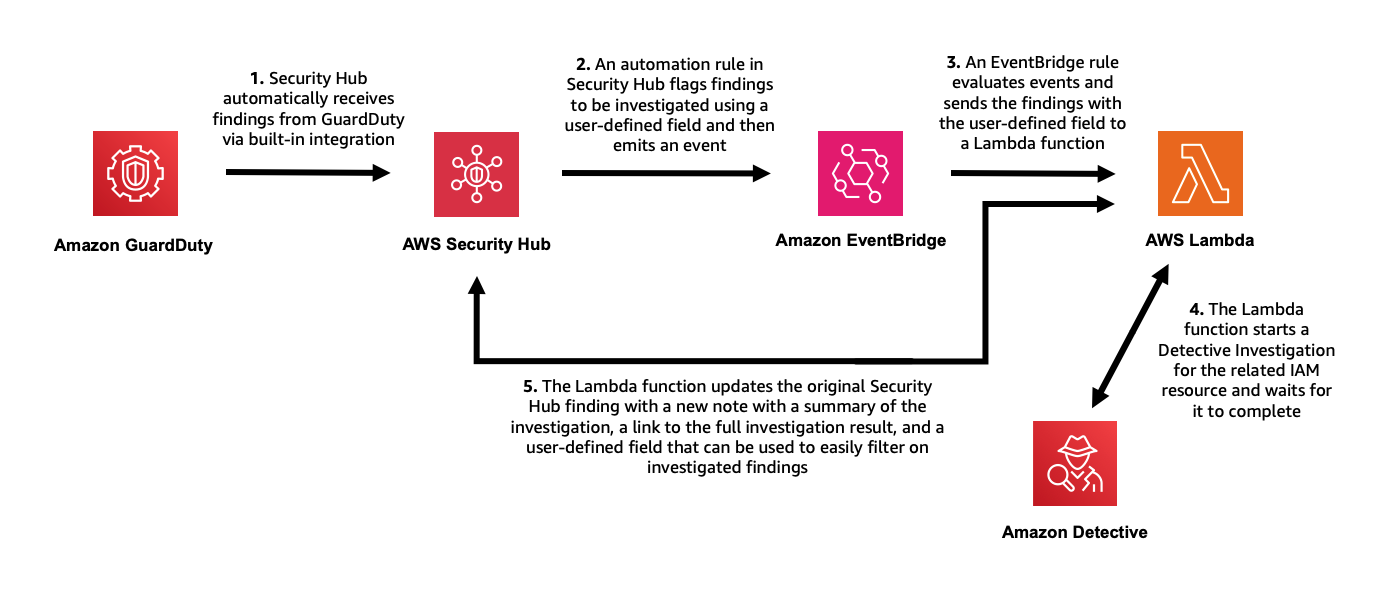
Security Hub automatically sends all new findings and all updates to existing findings to EventBridge as Security Hub Findings - Imported events. Each Security Hub Findings - Imported event contains a single finding. Security Hub also sends findings that are associated with custom actions to EventBridge as Security Hub Findings - Custom Action events. As shown in the architecture diagram below, you will use EventBridge Rules to invoke a Lambda function for each finding you enrich. You will use an EventBridge Rule for Imported events to automatically initiate the Lambda function for high (and medium) severity findings that are aggregated by Security Hub from GuardDuty. You will use a second EventBridge Rule for Custom Action events to initiate additional investigations and enrichment on-demand. Both EventBridge Rules will target the same Lambda function. The Lambda function calls the Detective Investigation API, waits for the results, and then calls the Security Hub API to update the finding.
Scenario / Problem Statement: Since your team turned on various AWS security services and aggregated everything in Security Hub, your leadership is asking for insights from all that data. In particular, you have been asked to glean insights on compliance, highest priority alerts, and resources generating the highest number of security alerts.
Retrieve investigative data from Detective using Lambda
You can start investigations in Detective and retrieve the results via API. To do this, you will use a Lambda function written in JavaScript (Node.js 20.x). AWS Lambda supports several programming languages, but you will use JavaScript in this example.
To start an investigation, you must supply the API with an Amazon Resource Name (ARN) of an IAM role or user, start time, end time, and the ARN of the Detective behavior graph. The Detective API will fetch the results of the investigation including indicators of compromise, TTPs (tactics, techniques, and procedures), and a categorical severity score. The severity score returned is computed using two dimensions; confidence and impact; where the confidence represents likelihood the events are anomalous and not normal user behavior. The second dimension is the impact; which quantifies harm that could occur from the events as a measure of TTPs’ effect.
First, create the Lambda function. Go to https://console.aws.amazon.com/lambda/home?#/create/function?intent=authorFromScratch .
On the Create function page, set the Function name to “InvestigateWithDetective” and pick Node.js 20.x for the Runtime.
Leave all of the other settings as they are. Click Create function.
Copy and paste the following code into the editor labeled Code source. This will be the target of the EventBridge rule in the architecture. The function takes the ARN from a GuardDuty security finding aggregated by Security Hub, and calls the Investigation API. When the result is returned, the function formats the data into the AWS Security Finding Format (ASFF) used by Security Hub, and calls the BatchUpdateFindings API to send the enriched, updated finding back to Security Hub.
"use strict";
import {
  DetectiveClient,
  GetInvestigationCommand,
  ListGraphsCommand,
  StartInvestigationCommand,
} from "@aws-sdk/client-detective";
import { BatchUpdateFindingsCommand, SecurityHubClient } from "@aws-sdk/client-securityhub";

const SHClient = new SecurityHubClient();
const detectiveClient = new DetectiveClient();

export const handler = async (event) => {
  try {
    // Handle only one (the first) finding per function call
    const finding = event.detail.findings[0];

    if (finding.ProductName != "GuardDuty") {
      // Handle only GuardDuty findings
      throw new Error("This is not a GuardDuty finding!");
    }

    const listgraphs = new ListGraphsCommand({});
    const graphs = await detectiveClient.send(listgraphs);
    const graphArn = graphs.GraphList[0].Arn;

    const IAMResourceARNs = finding.Resources.filter((resource) => {
      return (
        resource.Type == "AwsIamRole" ||
        resource.Type == "AwsIamUser" ||
        (resource.Type == "AwsIamAccessKey" && resource.Details.AwsIamAccessKey.PrincipalName != "aws:ec2-instance")
      );
    }).map((resource) => {
      if (resource.Type == "AwsIamRole" || resource.Type == "AwsIamUser") {
        return {
          arn: resource.Id,
          type: resource.Type == "AwsIamRole" ? "role" : "user",
        };
      } else if (resource.Type == "AwsIamAccessKey") {
        return {
          arn: `arn:aws:iam::${finding.AwsAccountId}:role/${resource.Details.AwsIamAccessKey.PrincipalName}`,
          type: "role",
        };
      }
    });

    if (IAMResourceARNs.length == 0) {
      throw new Error("No IAM resource to investigate!");
    }

    // Investigate the first IAM role or user identified in the finding
    const investigationTarget = IAMResourceARNs[0].arn;
    const investigationTargetType = IAMResourceARNs[0].type;

    const investigationEndTime = new Date(Date.now());
    investigationEndTime.setMinutes(investigationEndTime.getMinutes() - 5);

    let investigationStartTime;
    if (finding.FirstObservedAt) {
      investigationStartTime = new Date(finding.FirstObservedAt);
    } else if (finding.CreatedAt) {
      investigationStartTime = new Date(finding.CreatedAt);
    } else if (finding.ProcessedAt) {
      investigationStartTime = new Date(finding.ProcessedAt);
    } else {
      throw new Error("Investigation start time invalid!");
    }
    investigationStartTime.setHours(investigationStartTime.getHours() - 24);

    const totalInvestigationTime = Math.round(
      (investigationEndTime.getTime() - investigationStartTime.getTime()) / (1000 * 60 * 60),
    ); // Hours

    const startInvestigationRequest = {
      GraphArn: graphArn,
      EntityArn: investigationTarget,
      ScopeStartTime: investigationStartTime,
      ScopeEndTime: investigationEndTime,
    };

    const startinvestigation = new StartInvestigationCommand(startInvestigationRequest);
    const investigation = await detectiveClient.send(startinvestigation);
    const investigationId = investigation.InvestigationId;

    const getInvestigationRequest = {
      GraphArn: graphArn,
      InvestigationId: investigationId,
    };

    let investigationResult = { Status: "RUNNING" };
    while (investigationResult.Status == "RUNNING") {
      await new Promise((r) => setTimeout(r, 30000));
      const getinvestigation = new GetInvestigationCommand(getInvestigationRequest);
      investigationResult = await detectiveClient.send(getinvestigation);
      if (investigationResult.Status == "FAILED") {
        throw new Error("Detective investigation failed!");
      }
    }

    let investigationSummary = "";
    switch (investigationResult.Severity) {
      case "INFORMATIONAL":
      case "LOW":
        investigationSummary += `We did not observe uncommon behavior for the associated ${investigationTargetType} during the ${totalInvestigationTime} hour investigation window.`;
        break;
      case "MEDIUM":
        investigationSummary += `We observed anomalous behavior for the associated ${investigationTargetType} during the ${totalInvestigationTime} hour investigation window which might be indicative of compromise.`;
        break;
      case "HIGH":
      case "CRITICAL":
        investigationSummary += `We observed anomalous behavior for the associated ${investigationTargetType} during the ${totalInvestigationTime} hour investigation window indicating potential compromise.`;
        break;
      default:
        throw new Error("Severity information not found!");
    }

    investigationSummary += " For more information, visit ";
    investigationSummary += `https://${process.env.AWS_REGION}.console.aws.amazon.com/detective/home?region=${process.env.AWS_REGION}#investigationReport/${investigationResult.InvestigationId}`;

    const findingUpdateInput = {
      FindingIdentifiers: [
        {
          Id: finding.Id,
          ProductArn: finding.ProductArn,
        },
      ],
      Note: {
        Text: investigationSummary.substring(0, 512),
        UpdatedBy: "Detective Investigation Lambda function.",
      },
      UserDefinedFields: {
        investigate: "complete",
      },
    };

    const batchUpdateCommand = new BatchUpdateFindingsCommand(findingUpdateInput);
    const updatedFinding = await SHClient.send(batchUpdateCommand);

    return updatedFinding;
  } catch (error) {
    console.error("Error:", error);
    throw error;
  }
};
Then from the Code source menu, click File then Save.
Then click the Deploy button.
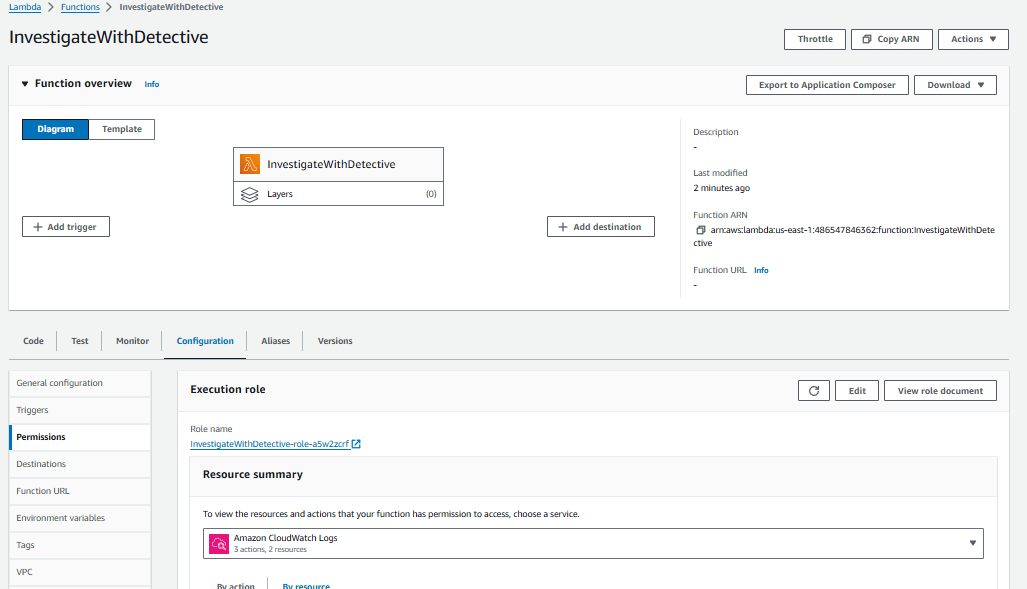
Above the Code source section for the Lambda function you created, click the Configuration tab.
On the General Configuration tab, click Edit.
The timeout of the function needs to be extended to a 15-minute timeout to allow Detective to complete the investigation. Update the timeout to be 15 minutes and click Save.
Directly above the Code source section for the Lambda function you created, click the Configuration tab.
For this function to work as desired, you will need to change the permissions function. The permissions need to include the necessary actions you are taking with Detective and Security Hub in the function. You need to add a new policy to the execution role for this Lambda function. Then click Permissions from the left navigation appears.
Click the Role name. It should start with “InvestigateWithDetective-role-”. This will take you to the role in the Identity and Access Management (IAM) console.
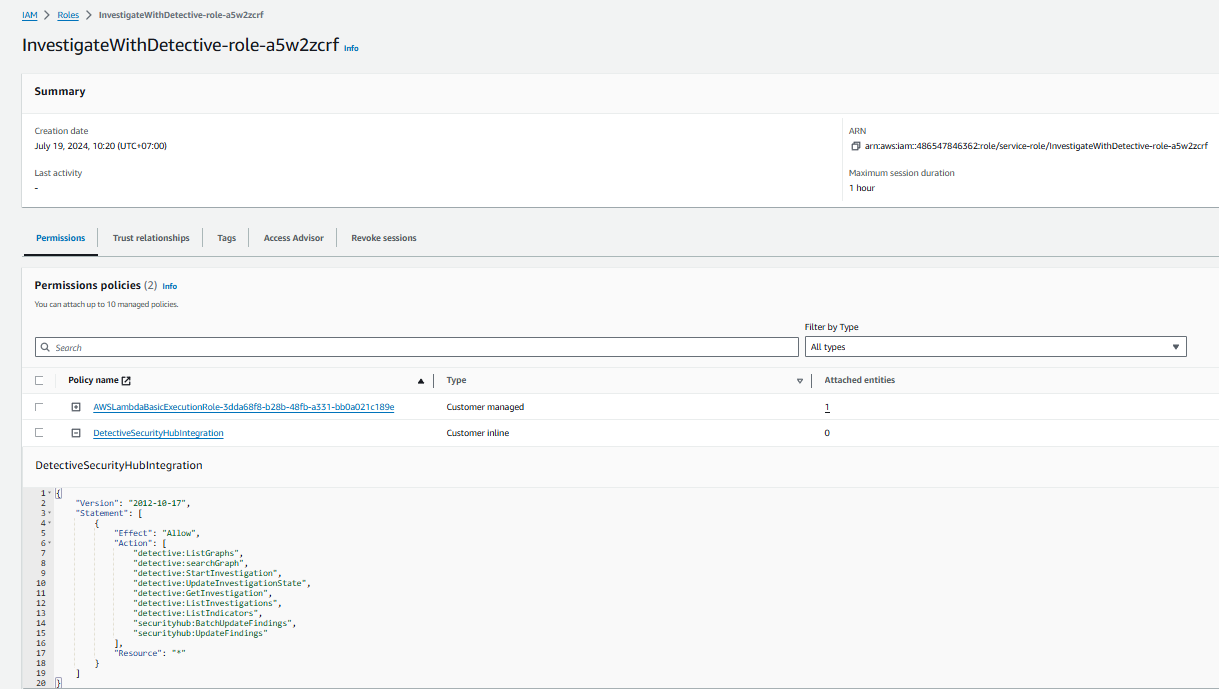
From the Role page, click the Add permissions button and select Create inline policy.
On the Create policy page, click the JSON tab. Then replace the existing policy with the following policy (do not use this policy in production, it does not quite follow least privilege and is meant as an example).
{
    "Version": "2012-10-17",
    "Statement": [
        {
            "Effect": "Allow",
            "Action": [
                "detective:ListGraphs",
                "detective:searchGraph",
                "detective:StartInvestigation",
                "detective:UpdateInvestigationState",
                "detective:GetInvestigation",
                "detective:ListInvestigations",
                "detective:ListIndicators",
                "securityhub:BatchUpdateFindings",
                "securityhub:UpdateFindings"
            ],
            "Resource": "*"
        }
    ]
}
Click the Next button. If you see a banner stating You need permissions, ignore it.
Give your policy the name “DetectiveSecurityHubIntegration” and click Create policy.
Set up automated investigations and finding enrichment with easy to configure filters
Now that you have GuardDuty, Security Hub, and Detective enabled (this was done for you) and have set up the Lambda function, you are ready to set up the two methods of initiating the investigations. The first approach involves automatically investigating and enriching HIGH and MEDIUM severity GuardDuty findings. This will accelerate investigations for the highest severity findings because you don’t need to go into Security Hub or Detective and manually select the findings for investigation.
In this approach, you will initiate the Lambda function you previously set up by using Security Hub Automations and an EventBridge Rule. Using Security Hub Automations allows you to configure and update what findings get automatically investigated and enriched without ongoing code changes (automation rules use a UI with dropdown options for criteria).
Open Security Hub and go to the Automations page.
Click Create rule.
Select Create custom rule.
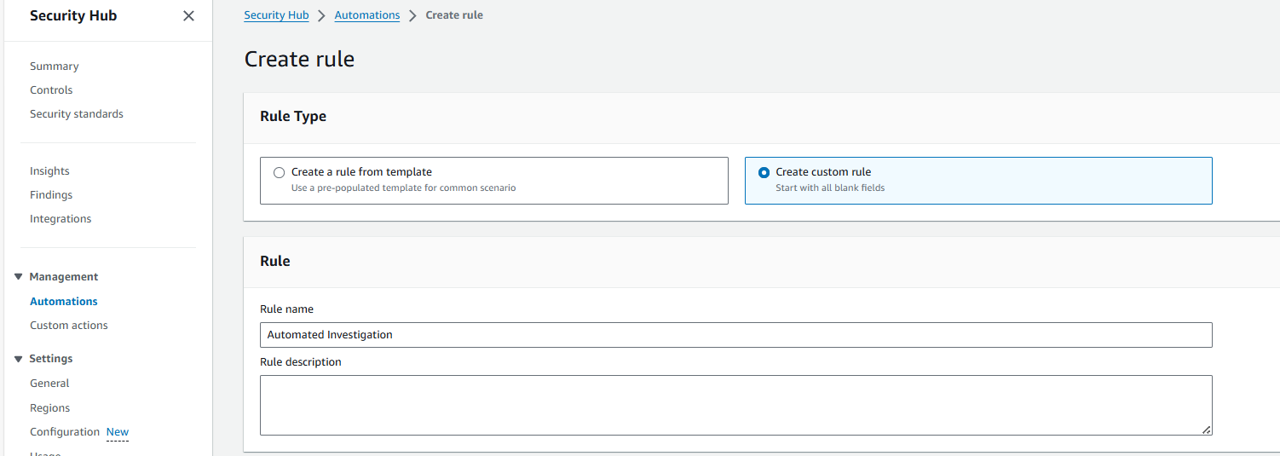
Name your rule “Automated Investigation” and give the rule a description.
Under Criteria, select ProductName for Key, Equals for Operator, and input “GuardDuty” for Value.
Click Add criteria.
For the second criteria, select SeverityLabel for Key, Equals for Operator, and HIGH for Value.
Then under that criteria, click the text, Add another value. This time select Equals for Operator and MEDIUM for Value.
Click Add criteria a third time. This time, select ResourceType for Key, Equals for Operator, and input “AwsIamAccessKey” for Value (case-sensitive).
Under the ResourceType criteria, click Add another value twice to add two more values. Use the operator Equals for both. Then use the Values “AwsIamUser” and “AwsIamRole”, respectively. Make sure the Criteria section matches the screenshot below.
(Index by workshop, not mistake)
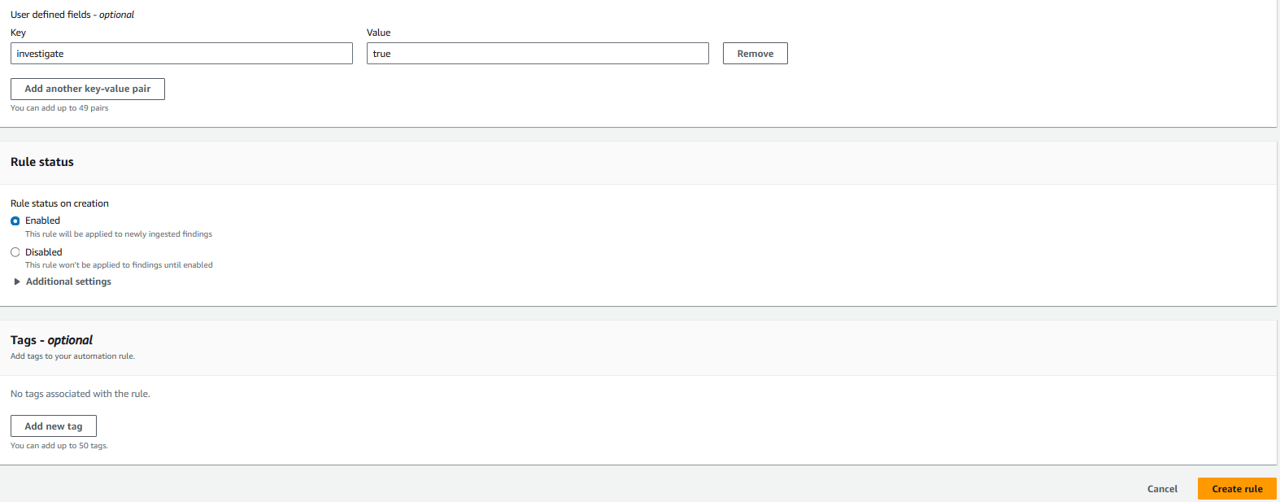
Scroll down to the Automated action section and click Add another key-value pair. This is how you will set a user-defined field to flag findings you want automatically investigated.
For the Key, input “investigate”, and for the Value, input “true”. Leave all of the other field as they are.
At the bottom of the page, click Create rule.
Next, you need to set an EventBridge Rule to determine which findings are investigated based on the user-defined field, you can use a single rule in Amazon EventBridge. In this case, the EventBridge Rule will look for Security Hub Findings – Imported. Each Security Hub Findings - Imported event contains a single finding. However, you only want to match findings that contain the user-defined field, “investigate”. Navigate to EventBridge.
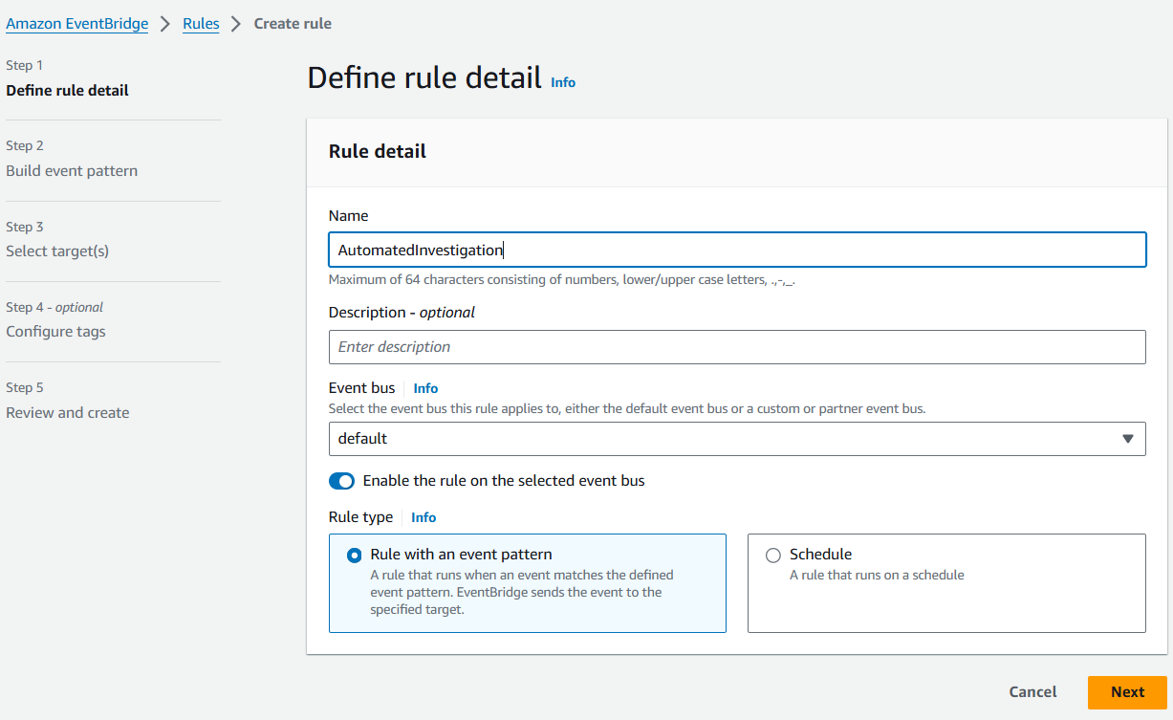
Click Create rule under Get started (with EventBridge Rule selected).
On the Define rule detail page, give your rule a name and description. For Name, input “AutomatedInvestigation”. Then click Next.
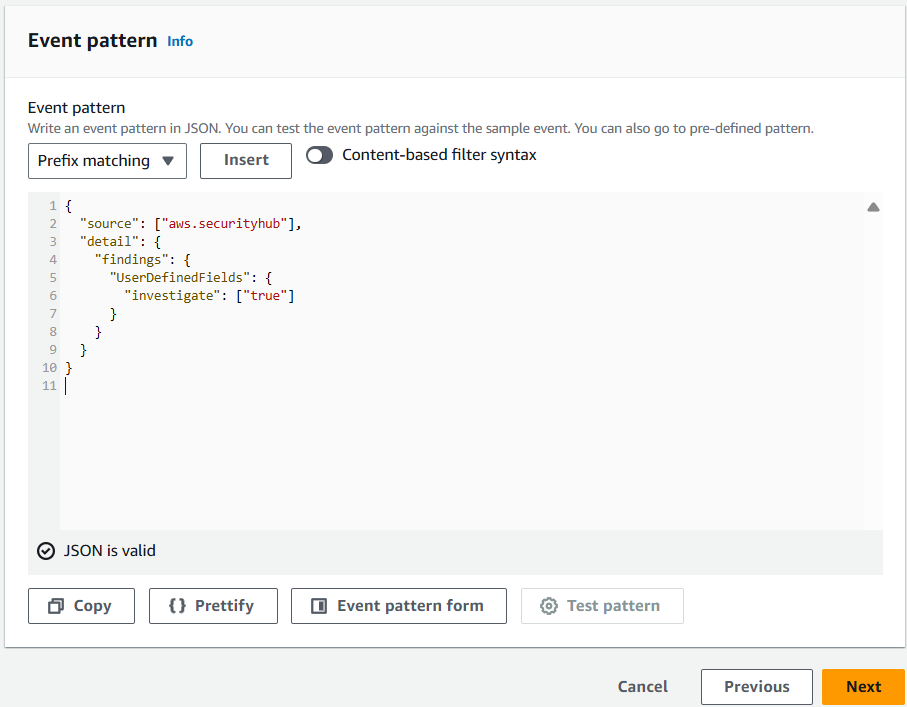
On the Build event pattern step, scroll down to Event pattern. Select the method Custom pattern (JSON editor). Copy and paste the following JSON into the Event pattern field.
{
  "source": ["aws.securityhub"],
  "detail": {
    "findings": {
      "UserDefinedFields": {
        "investigate": ["true"]
      }
    }
  }
}
Click Next.
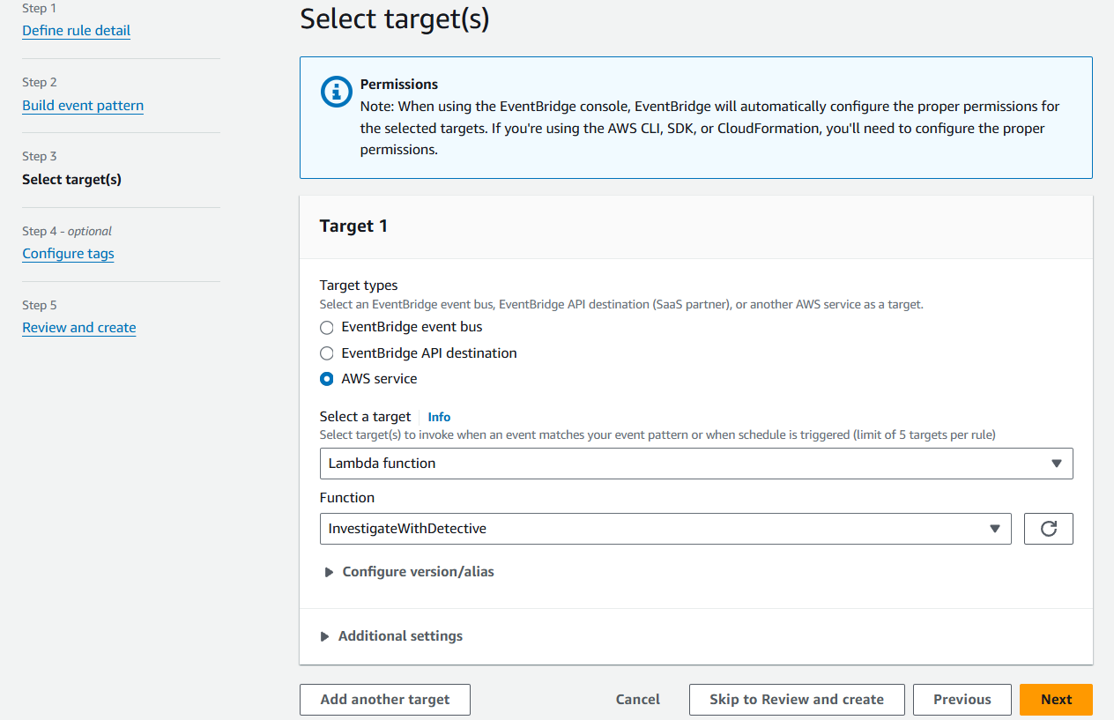
On the Select target(s) step, select Lambda function from the Select a target dropdown. Then select InvestigateWithDetective from the Function dropdown.
Click Next.
On the Configure tags step, click Next.
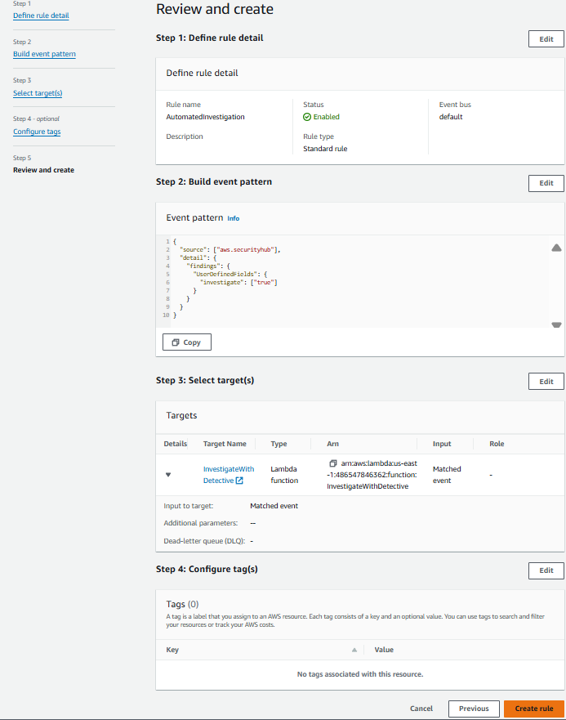
On the Review and create step, click Create rule. As new findings are aggregated in Security Hub, they will be evaluated and updated by the automation rule. Any that receive the user-defined field will initiate the Lambda function. After initiating the Lambda, it can take a couple minutes for the execution to complete and appear in Security Hub.
Note to Participants: It may be awhile before a finding is updated or created, which would initiate this automation. Move on with the instructions for now. In the next section, you will set up an process for initiating finding investigation and enrichment on-demand.
Set up on-demand finding investigation and enrichment
The second approach involves investigating and enriching findings on-demand. You may want both approaches in case there are findings that don’t meet the criteria of your earlier automation that you still want to investigate.
In this approach, you will initiate the same Lambda function through the use of a feature in Security Hub called Custom Actions. Open Security Hub and go to the Custom actions page.
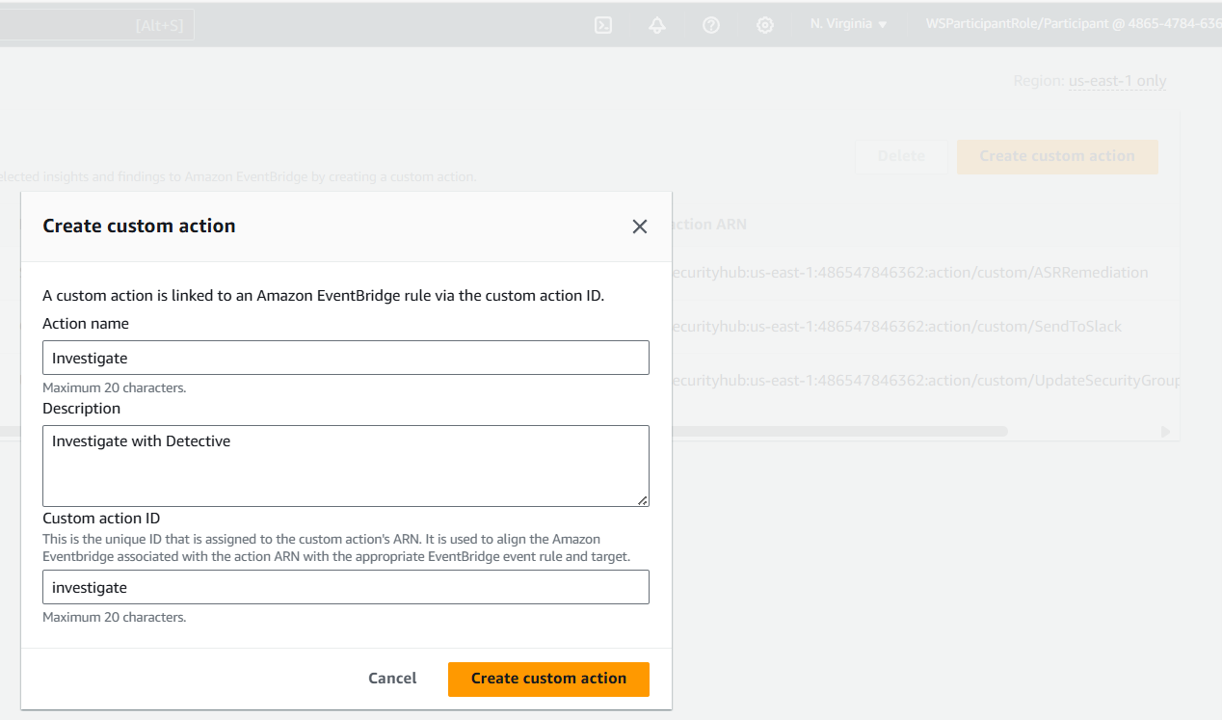
Click Create custom action.
For Action name input “Investigate”. For Action Description input “Investigate with Detective” For Action ID input “investigate”.
Click Create custom action.
Copy the Custom action ARN that was generated for your custom finding. You will need this in a few steps.
Next, you will need to create another rule in EventBridge, but this time it will match events for your custom action. Navigate to EventBridge.
Click Create rule under Get started (with EventBridge Rule selected).
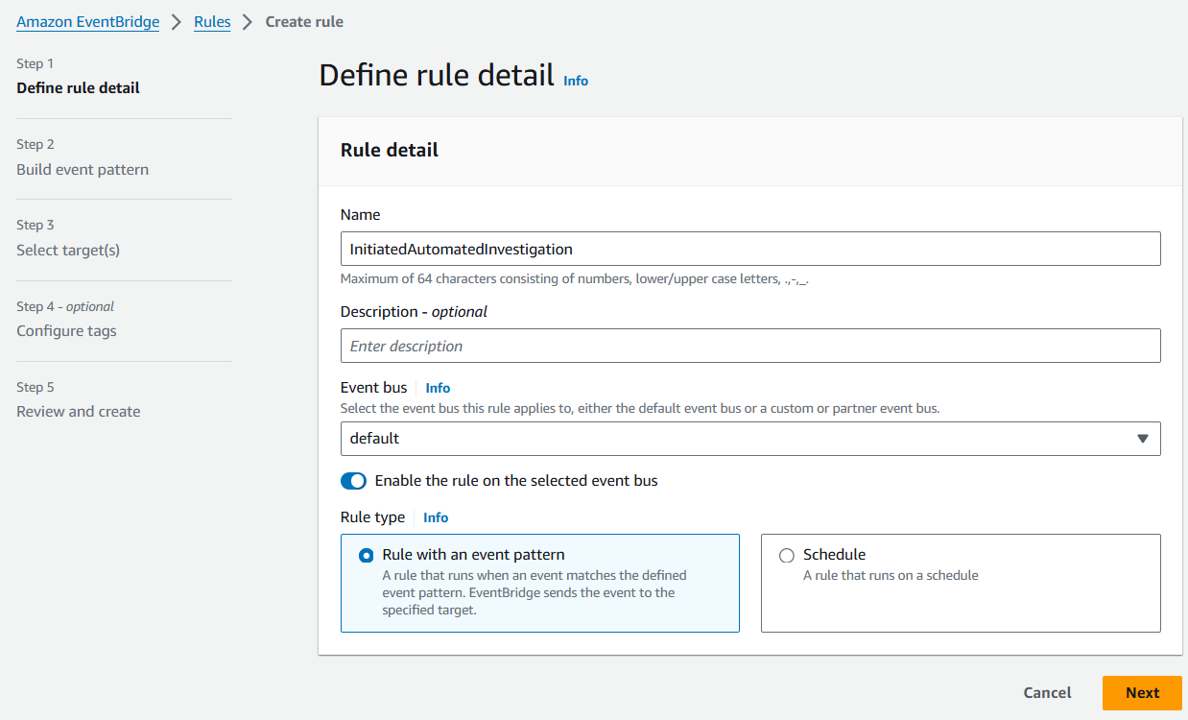
On the Define rule detail page, give your rule a name and description. For Name, input “InitiatedAutomatedInvestigation”. Then click Next.
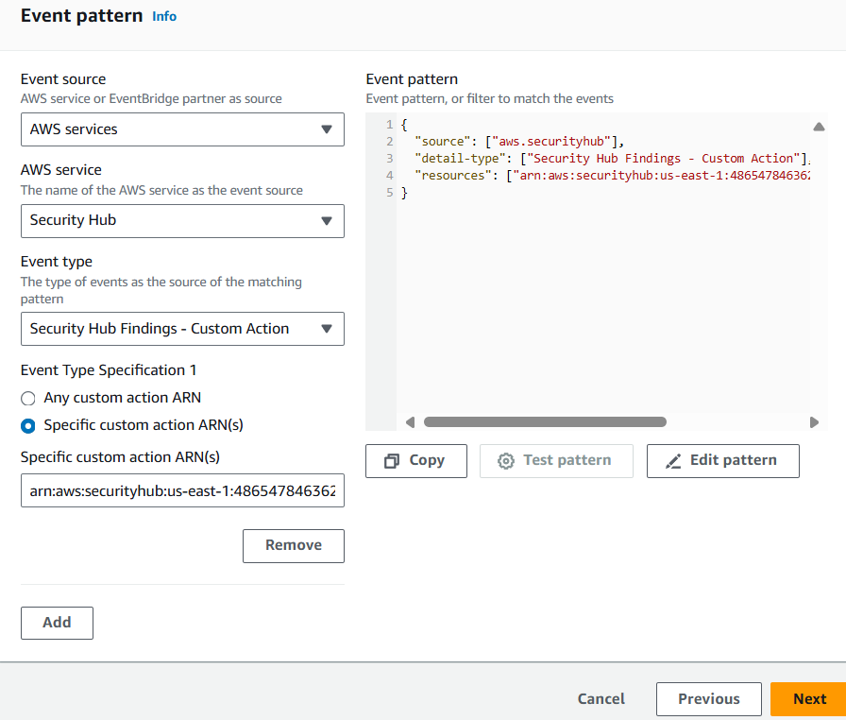
On the Build event pattern step, scroll down to Event Pattern. Leave the Event source set to AWS Services. Scroll down to Event pattern. Under Event source, select Security Hub.
For the Event Type, choose Security Hub Findings – Custom Action.
Then select the Specific custom action ARN(s) radio button and input the ARN for the custom action that you created earlier.
Click Next.
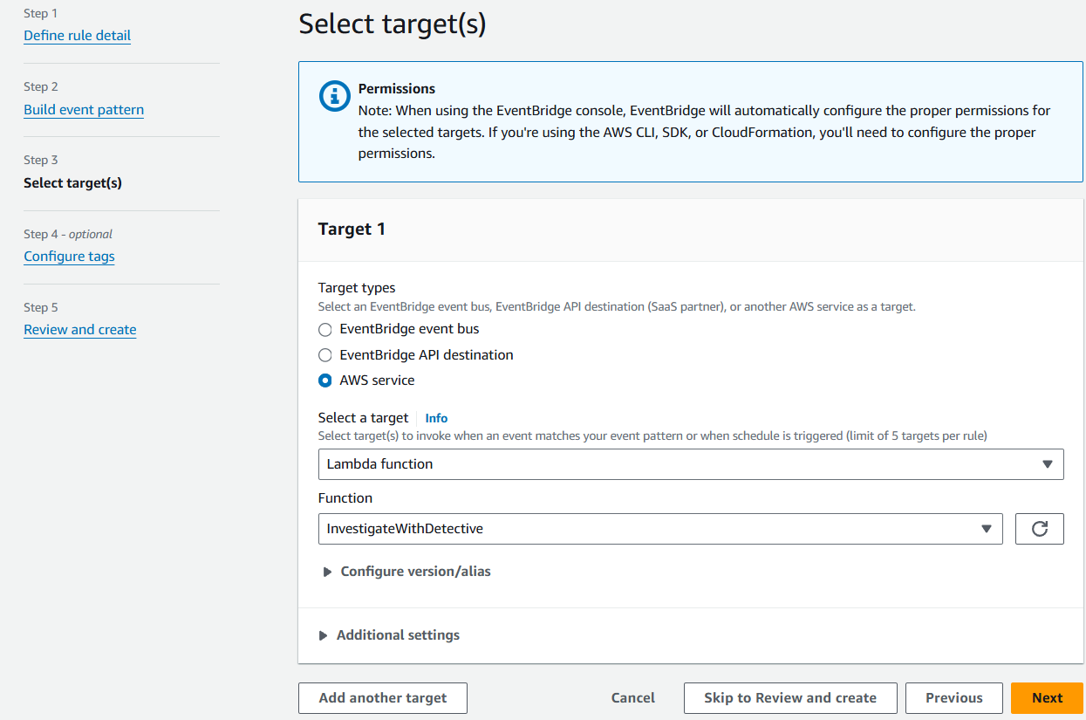
On the Select target(s) step, select Lambda function from the Select a target dropdown. Then select InvestigateWithDetective from the Function dropdown.
Click Next.
On the Configure tags step, click Next.
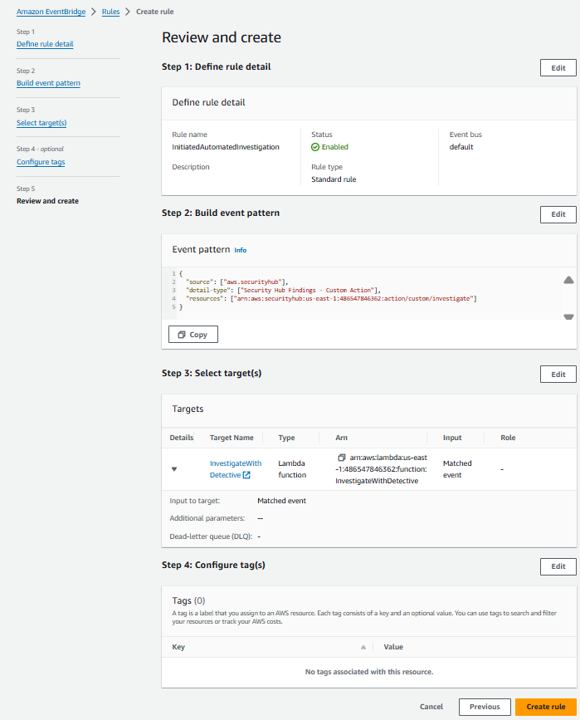
On the Review and create step, click Create rule.
Initiate an on-demand finding investigation
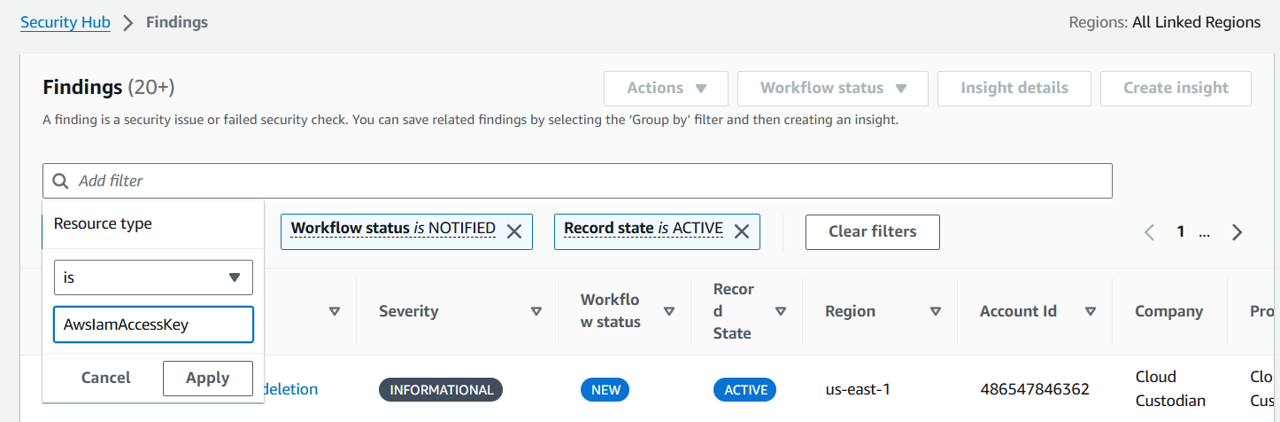
Return to Security Hub. Open the Findings page.
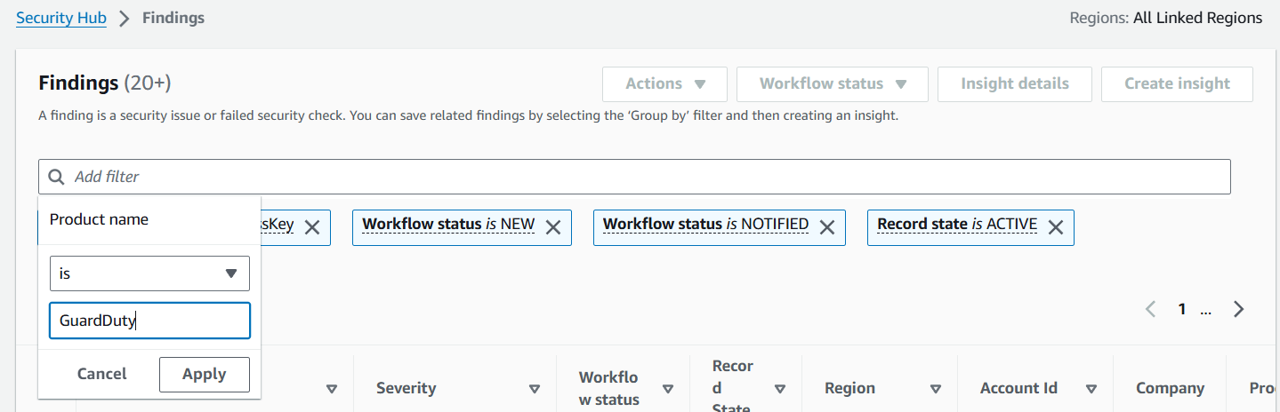
In the Add filter input, add a filter for Resource Type. Set the filter to Resource Type is AwsIamAccessKey (case sensitive). Click Apply.
In the Add filter input, add a filter for Product Name. Set the filter to Product Name is GuardDuty (case sensitive). Click Apply.
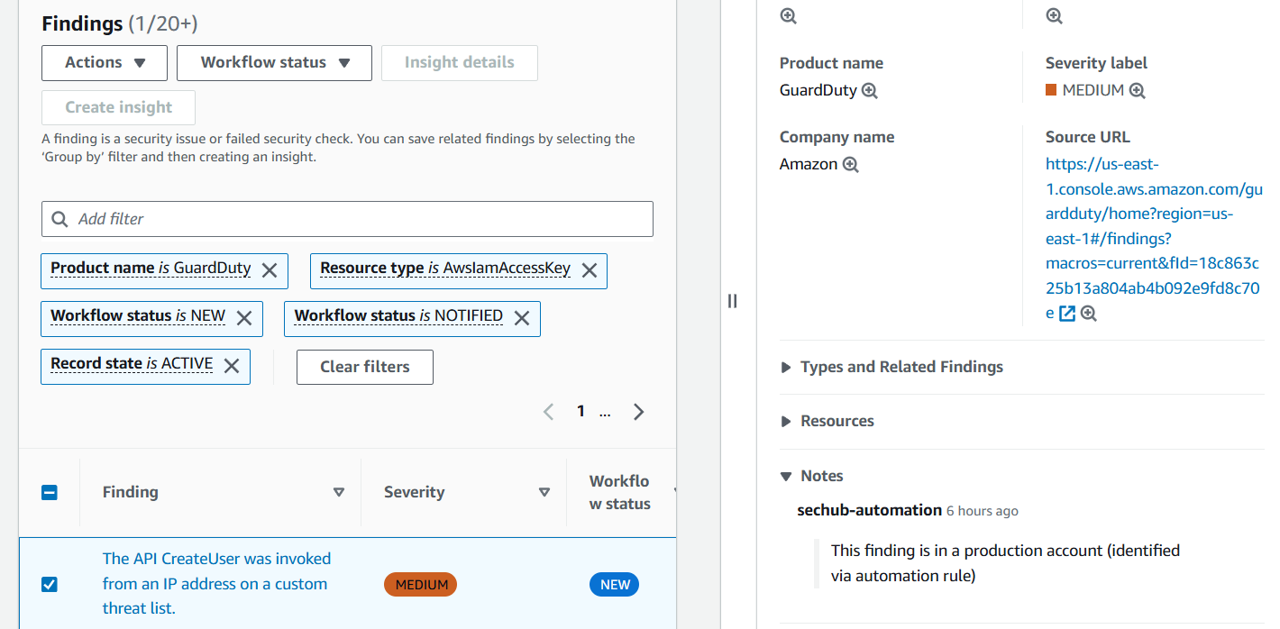
Click the title of the a finding in the list and check if there are any Notes present. If there are, expand the section and see what the notes are (if present, can you tell where the note came from?). Note:
Do not select the finding regarding RegisterManagedInstance.
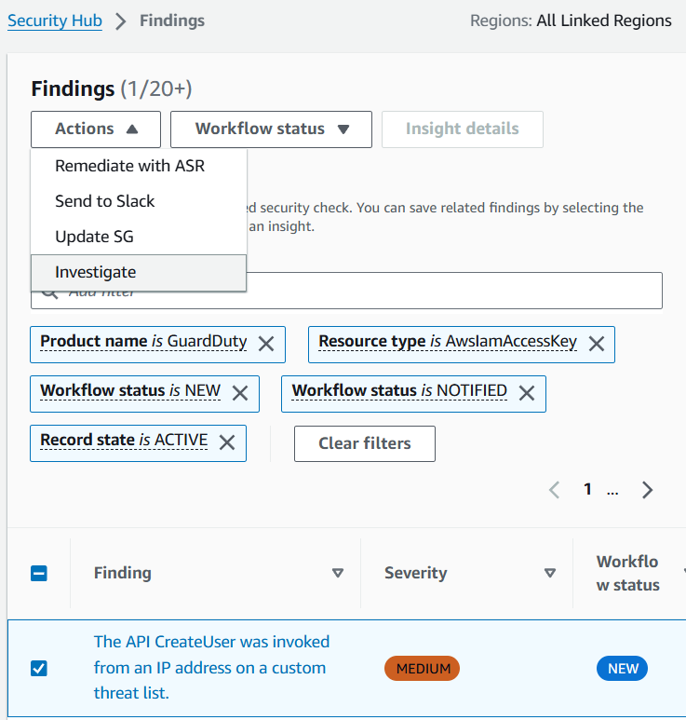
Click the check box to the left of this same finding to select it.
In the Actions dropdown, select your new custom action (Investigate).
 Choose another finding to investigate:
 After 3 minutes:
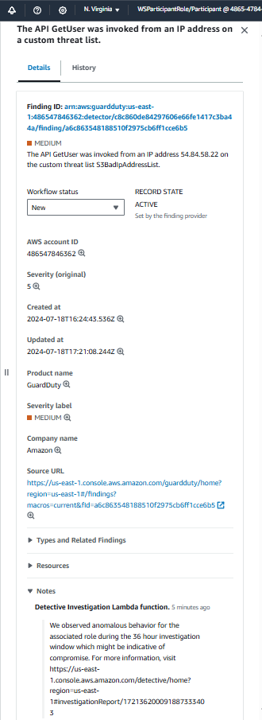
This may take up to 15 minutes for the investigation to complete. Refresh the page every couple minutes until the finding has a new Notes section in the details. Click the title of the same finding and expand the Notes section. Waiting after 5 minutes to see the node update:
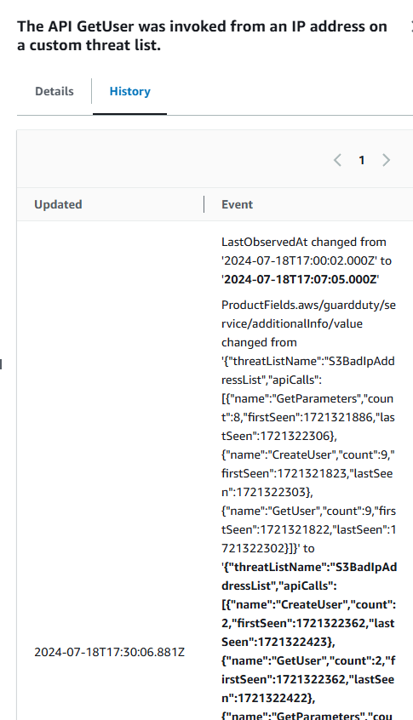
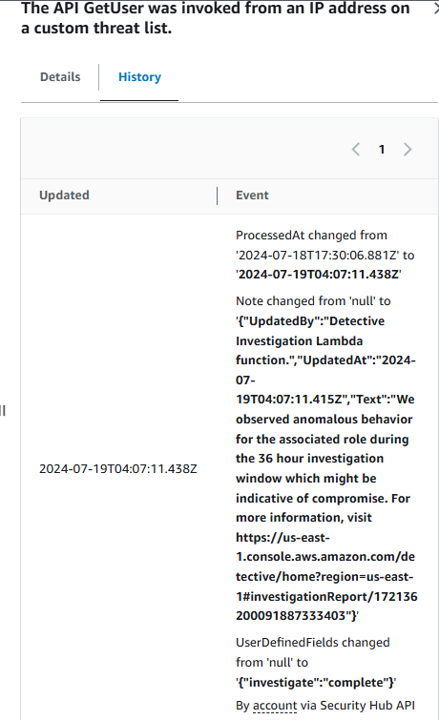
You can also toggle to the History tab in the finding details to see the timestamped event with the Note change.
Surface investigated findings in a custom insight
If you want to easilly track resources and findings that have been investigated through either of the approaches you implemented, create a new custom insight in Security Hub. Open Security Hub and go to the Insights page.
Click Create insight.
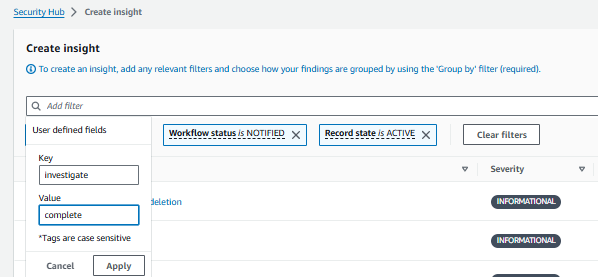
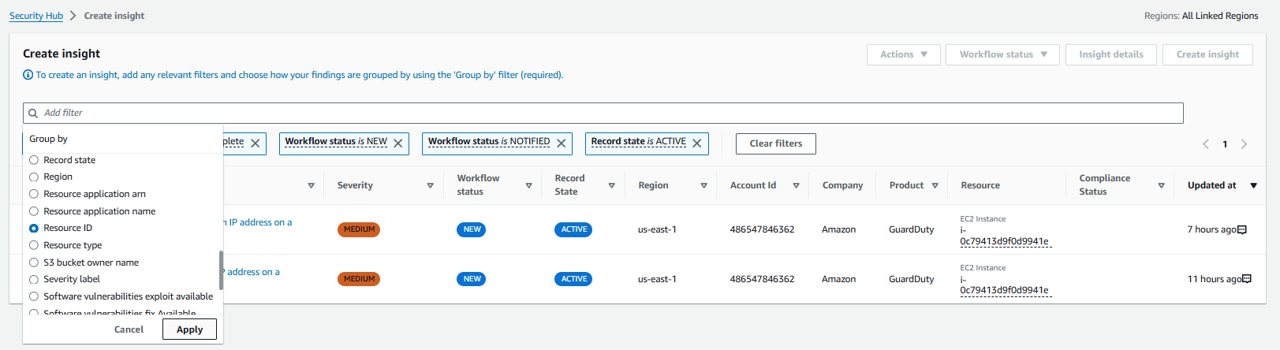
Click the field that states “Add filter” at the top of the page and select User defined fields.
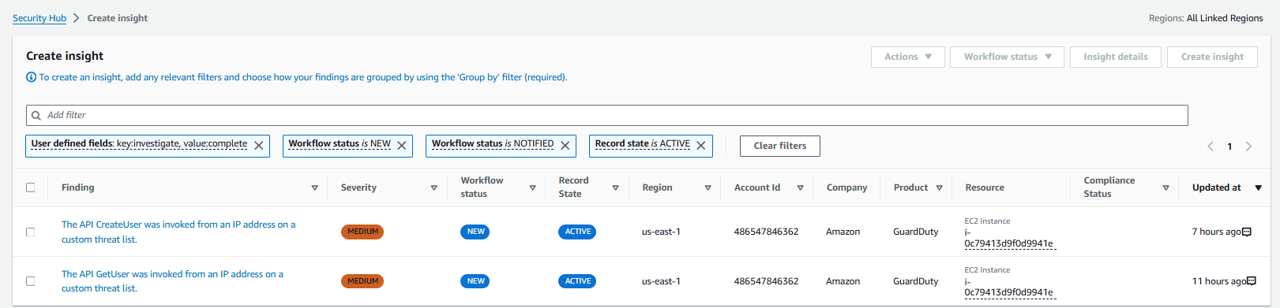
Set Key to investigate and Value to complete. This will filter the list of findings to only those that were successfully enriched. Click Apply.
 Result:
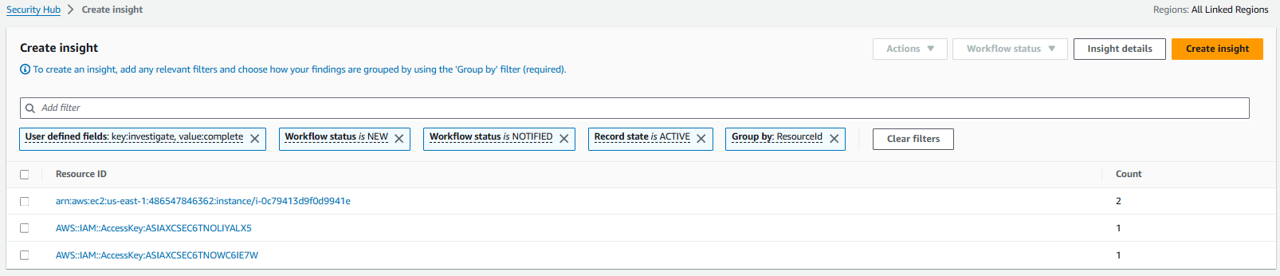
Click the field that states “Add filter” at the top of the page again and select GroupBy. Then pick Resource ID. Click Apply.
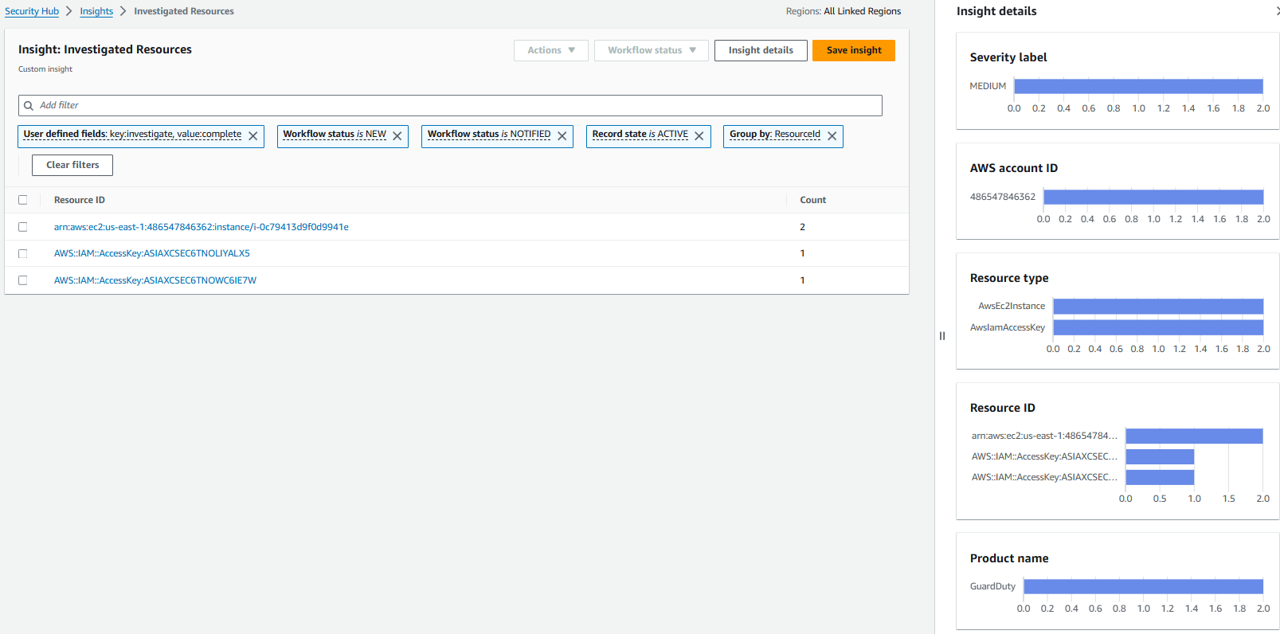
The insight is now showing a list of resources and a count of how many active, associated findings are investigated and enriched.
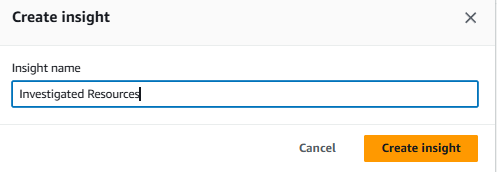
Click Create insight. Name your insight “Investigated Resources” and click Create insight again.
At the top of the page, click Insight details to see the graphs for the new insight.